Products
Explore all platforms & products
Our flexible test platforms are built on proven architectures with integrated IP, enabling maximum reuse and faster deployment for product design, manufacturing and support.
Find the right platform for your application- AST-1000 - Averna Signal TesterSoftware-defined infotainment RF signal source
- DNA SeriesDigital phase noise & stability analyzers
- ESUS – RF Detection and Identification SystemPortable RF detection, 30 MHz–6 GHz
- RP-6500 - Wideband RF Record & Playback System500 MHz signal capture & GNSS simulation
- Wideband RF Up & Down ConverterUp to 40 GHz with 2 GHz bandwidth
- Protection Jammer TesterGo/no-go checks for RF jammers
- VeriDASEnd-to-end test of aircraft DAS suites
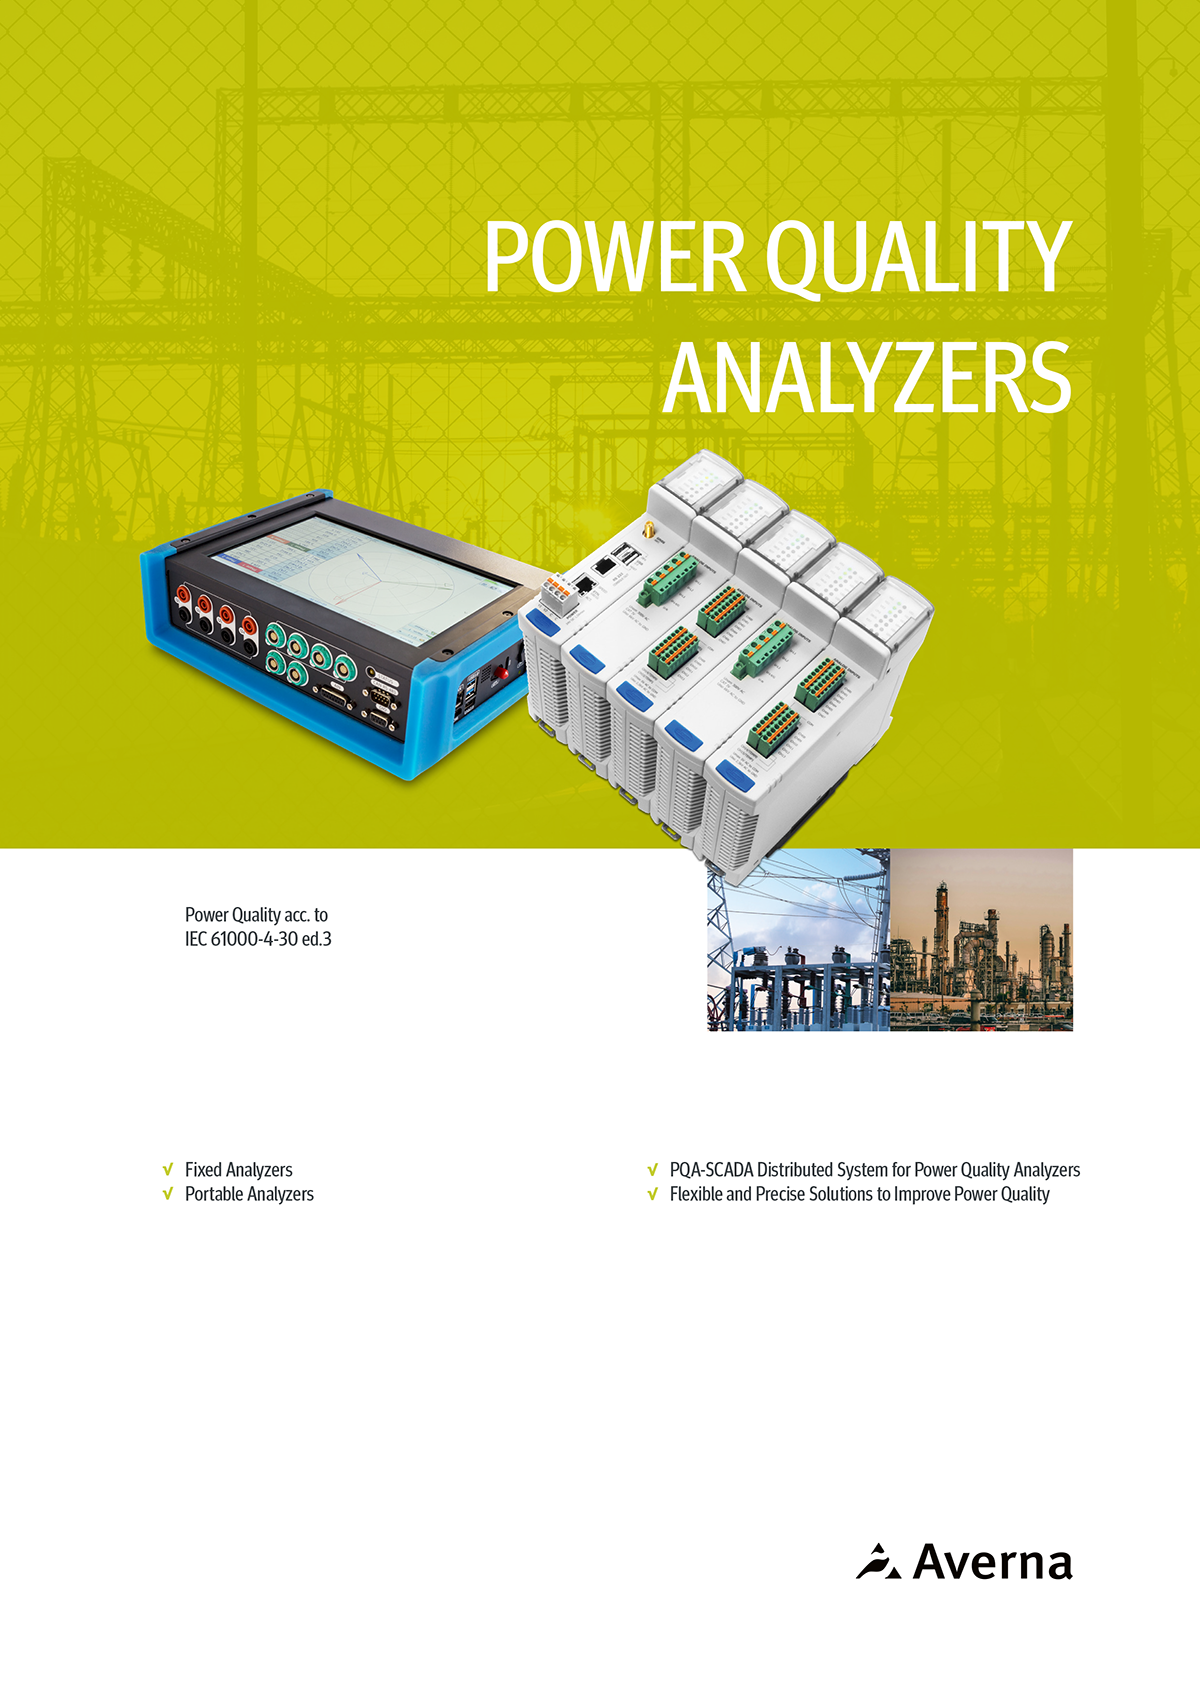
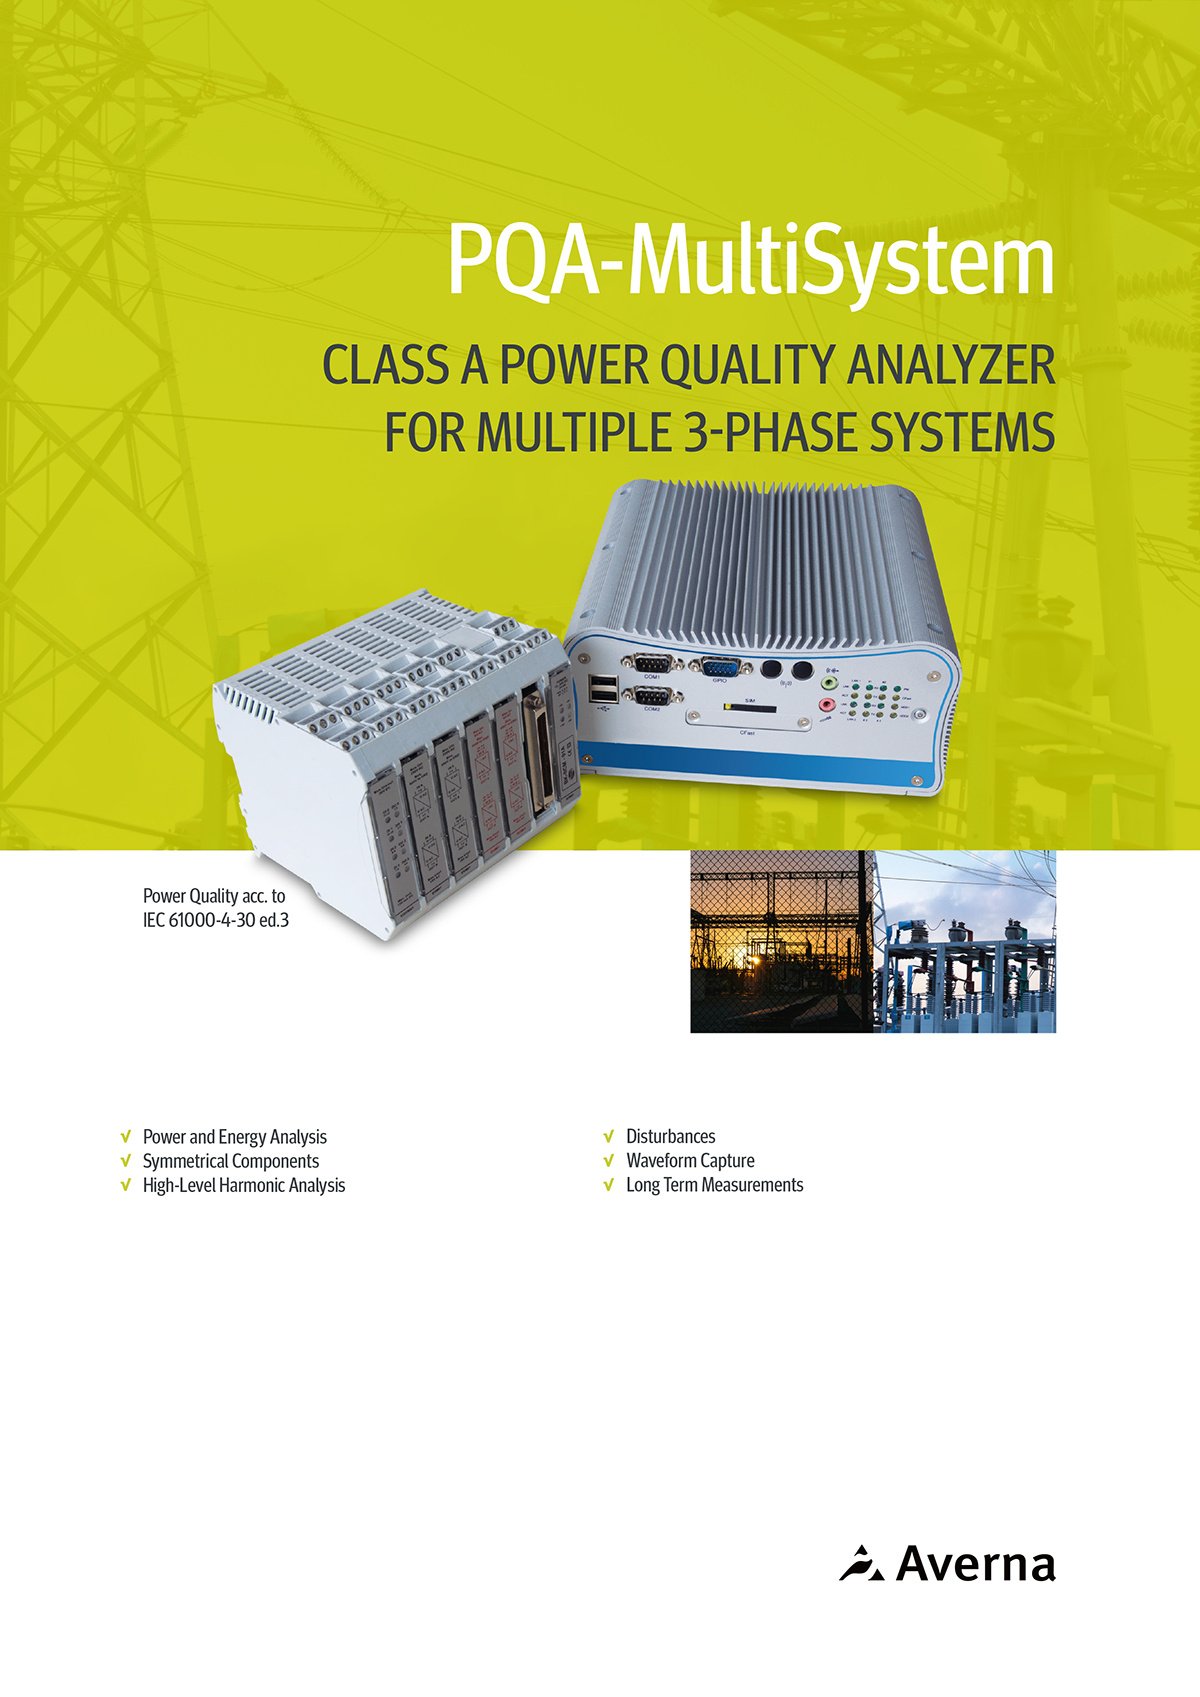
- Power Quality AnalyzersClass A power quality analyzers for utilities, grid operators and industry
- PLUTON Series®Power emulation platform for real-time validation testing of electrical systems
- Linear Power AmplifierPrecision linear AC/DC power supply solution
- MAGSET® SeriesAutomatic magnetic adjustment solution for differential relays and circuit breakers
- Proligent™ - Test Data AnalyticsSmart test data management & reporting
- NewWaveX®Automated test generation for complex systems
- Averna DeployAutomated test code deployment at scale
- Shopfloor Test Management PlatformEnd-to-end test lifecycle management
Resources
Visit our Resource CenterKnowledge & Engineering
Events & Media



What is PQA-SCADA?
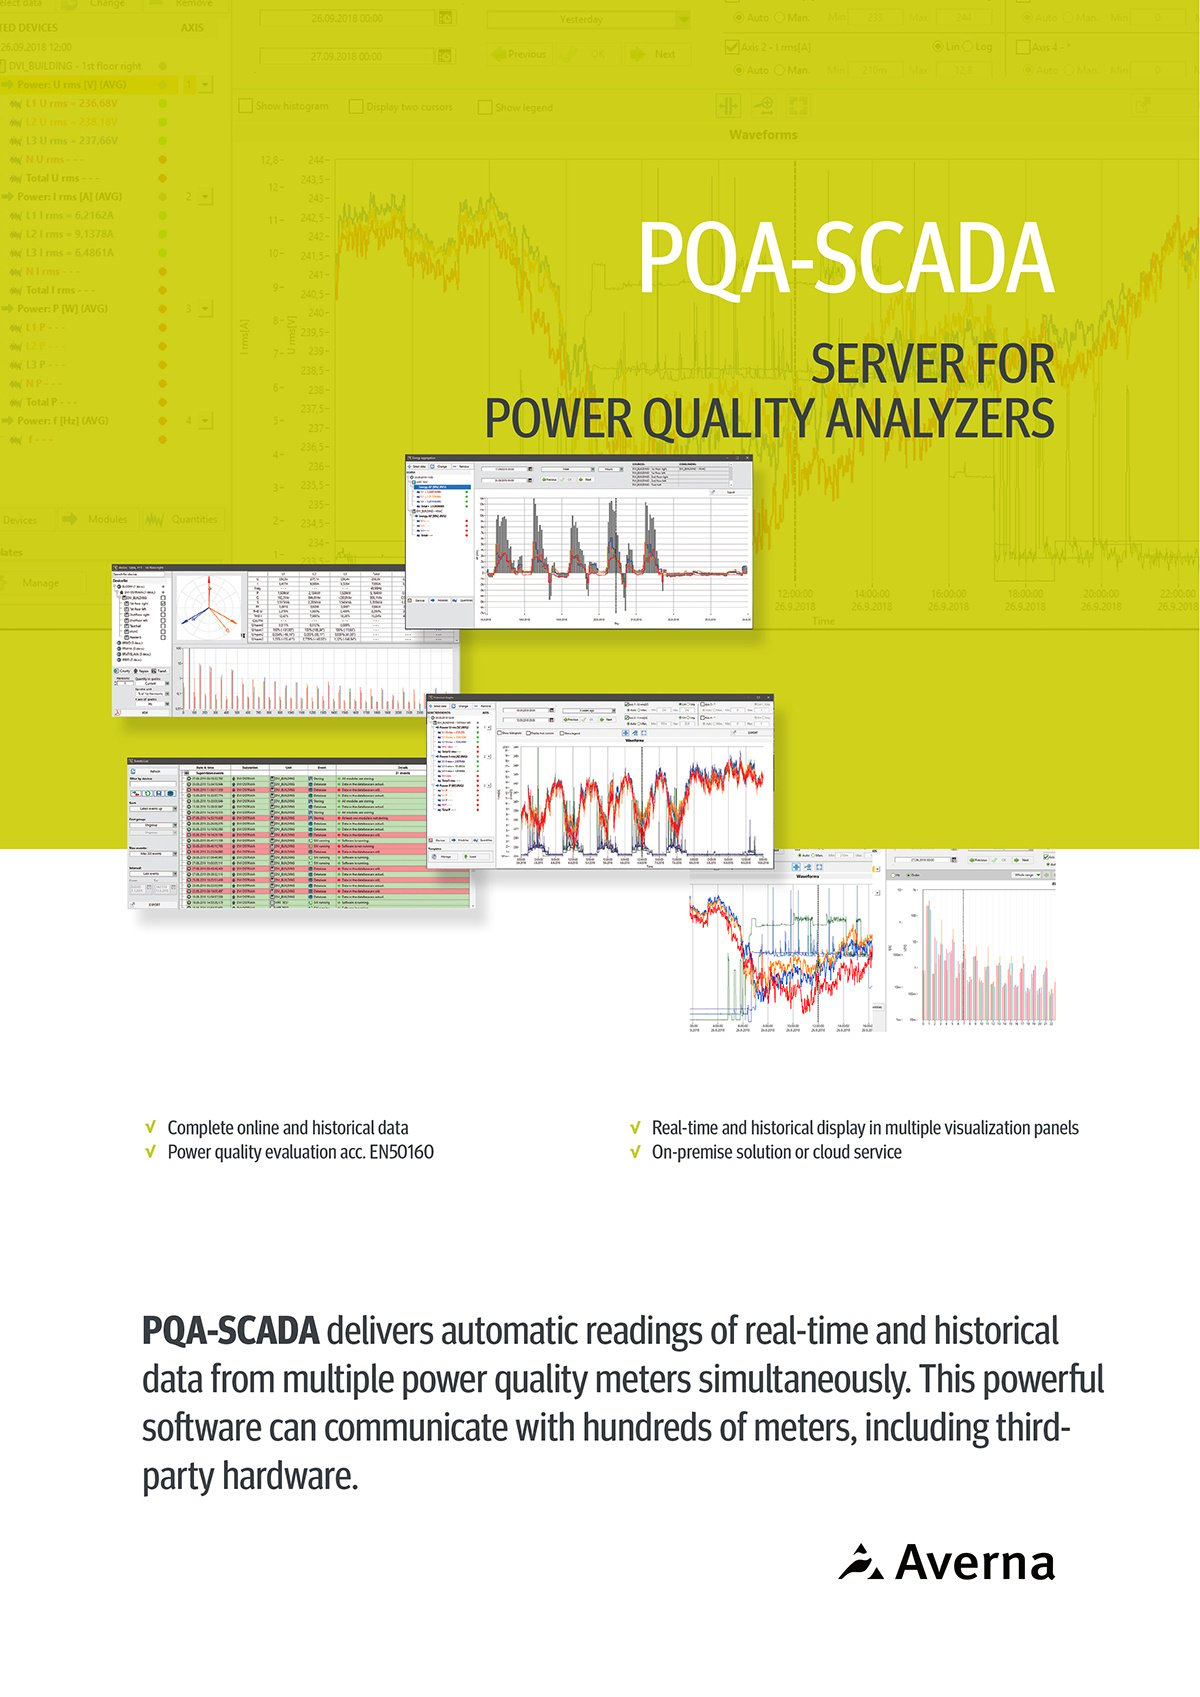
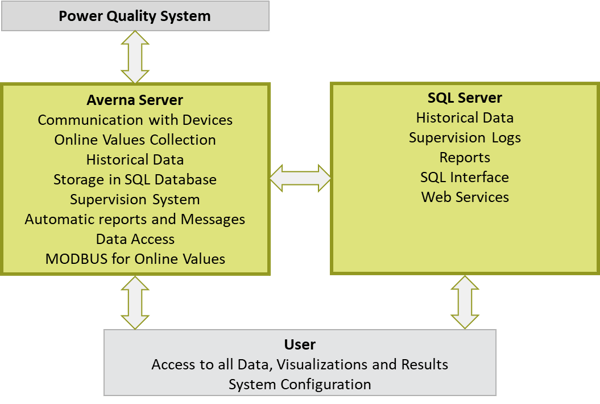
PQA-SCADA is dedicated software for power quality systems. This software can communicate with hundreds of meters, and can support also third-party hardware. It delivers complete online and historical data for power quality evaluation acc. EN50160.
Main Software Features
Automatic Reading of Real-Time and Historical Data
Communication using device specific protocols and formats and compatible with 3rd-party devices.
Storage of all Historical Data into SQL Database
All historical data, protocols, supervision records and more are stored in a SQL database. Data is not encrypted, and it is also available to other users with sufficient user rights.
Reports
Users can easily export every viewed panel including basic measurement information. Automatic reports can also be configured for events (disturbances and transients).
Notifications
Systems can send notifications automatically and add reports under certain circumstances. Sending may be triggered by the event on a device (Voltage Event, Transient record detected) or by the supervision event.
 System Supervision Details
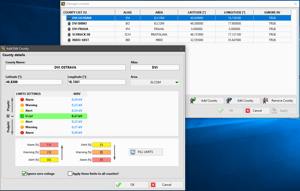
The powerful supervisory management monitors each device status and its fault state. Supervision overview distinguishes between two states: OK and Failed.
The software uses a "ping" command and waits for the reply to determine whether the device is accessible or not. System also checks that the software on the device is running, if data storing is enabled, and if data from PQ monitir device was copied to the database (including "database full" detection).
EN50160 Global Evaluation Details
Comprehensive overall power quality result across all meters/substations/regions and whole year in one screen. This visualization provides statistical evaluation of each 3-phase system/week result (pass/fail) over the whole grid. This quickly identifies the regions with weak power quality. The percentage of final PQ results (number of good/bad points) for each substation and region thru the whole year is displayed.
Virtual Energy Meter
Virtual energy meter is a special type of instrument in an application that consists of a list of positive and negative real meters. Its historical data (energy) can be viewed in the same as from real devices; the server automatically calculates the sum of positive and negative components. The input and all outputs of the local network are monitored, the total balance (losses) can be displayed.
Events Detection
Automatically generated events list captured by the meter itself or captured by Master Station (custom events):
- Alarm
- Voltage harmonic alarm
- Voltage alarm
- Transient
- Disturbance
- EN50160 event
- Custom event
Configurable System Hierarchy
- Devices
- Users
- Substations/Areas
- Protocols
- Notifications
- Supervision